Reforge has joined Miro ↗
The Top 7 ROI Analysis Templates To Track Your Profits
Return on Investment (ROI) is a fundamental financial metric used to assess the profitability of an investment relative to its cost of the investment. It measures the efficiency of an investment by comparing the gain or loss generated from the investment relative to its initial cost. Calculating ROI is crucial for businesses and individuals to evaluate the success of their investment decisions.
In this guide, we'll delve into the intricacies of ROI calculation, providing you with essential insights and free templates to streamline your analysis.
What Is Return on Investment (ROI)?
Return on Investment (ROI) is a crucial financial metric used to assess the profitability of an investment. It measures the incremental revenue generated relative to the investment cost. However, to accurately evaluate ROI, all associated total costs must be considered, including operational expenses, like materials, personnel, and other overheads.
Importance of Considering All Costs
Calculating ROI involves more than just looking at revenue. Operational costs, such as materials and labor, should be subtracted to determine the actual net profit generated. For instance, a $100K investment in manufacturing equipment may yield $500K in revenue, but after factoring in operational expenses, the actual profit may be less.
Example Illustration
Let's consider a scenario where a company invests $100,000 in a new CRM system, expecting to save $40,000 annualized ROI in staffing costs. While the revenue generated from the CRM system may be significant, it's essential to calculate ROI accurately by subtracting operational expenses.
ROI = [(Revenue - Operational Costs) / Investment Cost] x 100
In this example, the CRM system's ROI may initially appear negative (-68%) due to the high upfront costs. However, over a period of time, considering the long-term benefits and cost savings, the investment may become profitable.
Key Points To Remember
ROI calculation involves considering all costs associated with an investment.
Operational expenses should be subtracted from revenue to determine actual profit.
Accurately analyzing ROI helps in making informed investment decisions and evaluating the true financial impact of investments.
How To Calculate ROI in 5 Steps
Calculating marketing ROI in Excel can be simplified into a few straightforward steps:
**Set Up Your Spreadsheet: **Open Excel and create a new spreadsheet. Label one column for sales revenue and another for marketing costs. Enter the corresponding data for each.
Enter Your Data: Input the total sales revenue generated by your marketing campaign in the sales revenue column. Then, add the total amount spent on marketing activities in the marketing costs column.
Apply the ROI Formula: In a free cell, input the ROI formula: (Sales Revenue - Marketing Costs) / Marketing Costs. For example, if your sales revenue is in cell B2 and marketing costs are in cell B3, the formula would be =(B2 - B3) / B3.
Calculate ROI: Press enter or return on your keyboard to calculate the ROI. The result will be displayed as a decimal. To format it as a percentage, select the cell and go to the Home Tab > Number > Percentage.
Interpret and Communicate Results: Once you have calculated the ROI, interpret the result. A positive ROI indicates that your marketing campaign generated more revenue than it cost, while a negative ROI means the opposite. Provide context for the data when communicating it to stakeholders, highlighting the success and impact of the campaign.
By following these steps, you can effectively calculate and communicate the return on investment of your marketing efforts using Excel.
7 ROI Templates By Experts To Use in 2024
SEO Content ROI Model at Graphite
Developed by Ethan Smith, CEO @ Graphite

This ROI model, crafted by Graphite, offers a versatile framework for predicting traffic and assessing the net return on investment for SEO articles. Ethan's model utilizes observed traffic data over several months to extrapolate future traffic trends.
Notably, it projects a traffic plateau by the third year and demonstrates a payback period of six months, indicating a transition from negative to positive profit. This model equips businesses with valuable insights into the long-term profitability of their SEO content initiatives.
ARPU Analysis at a Fintech Startup
Crafted by Abhinandan Yadav, Product Manager, Growth @ Beem
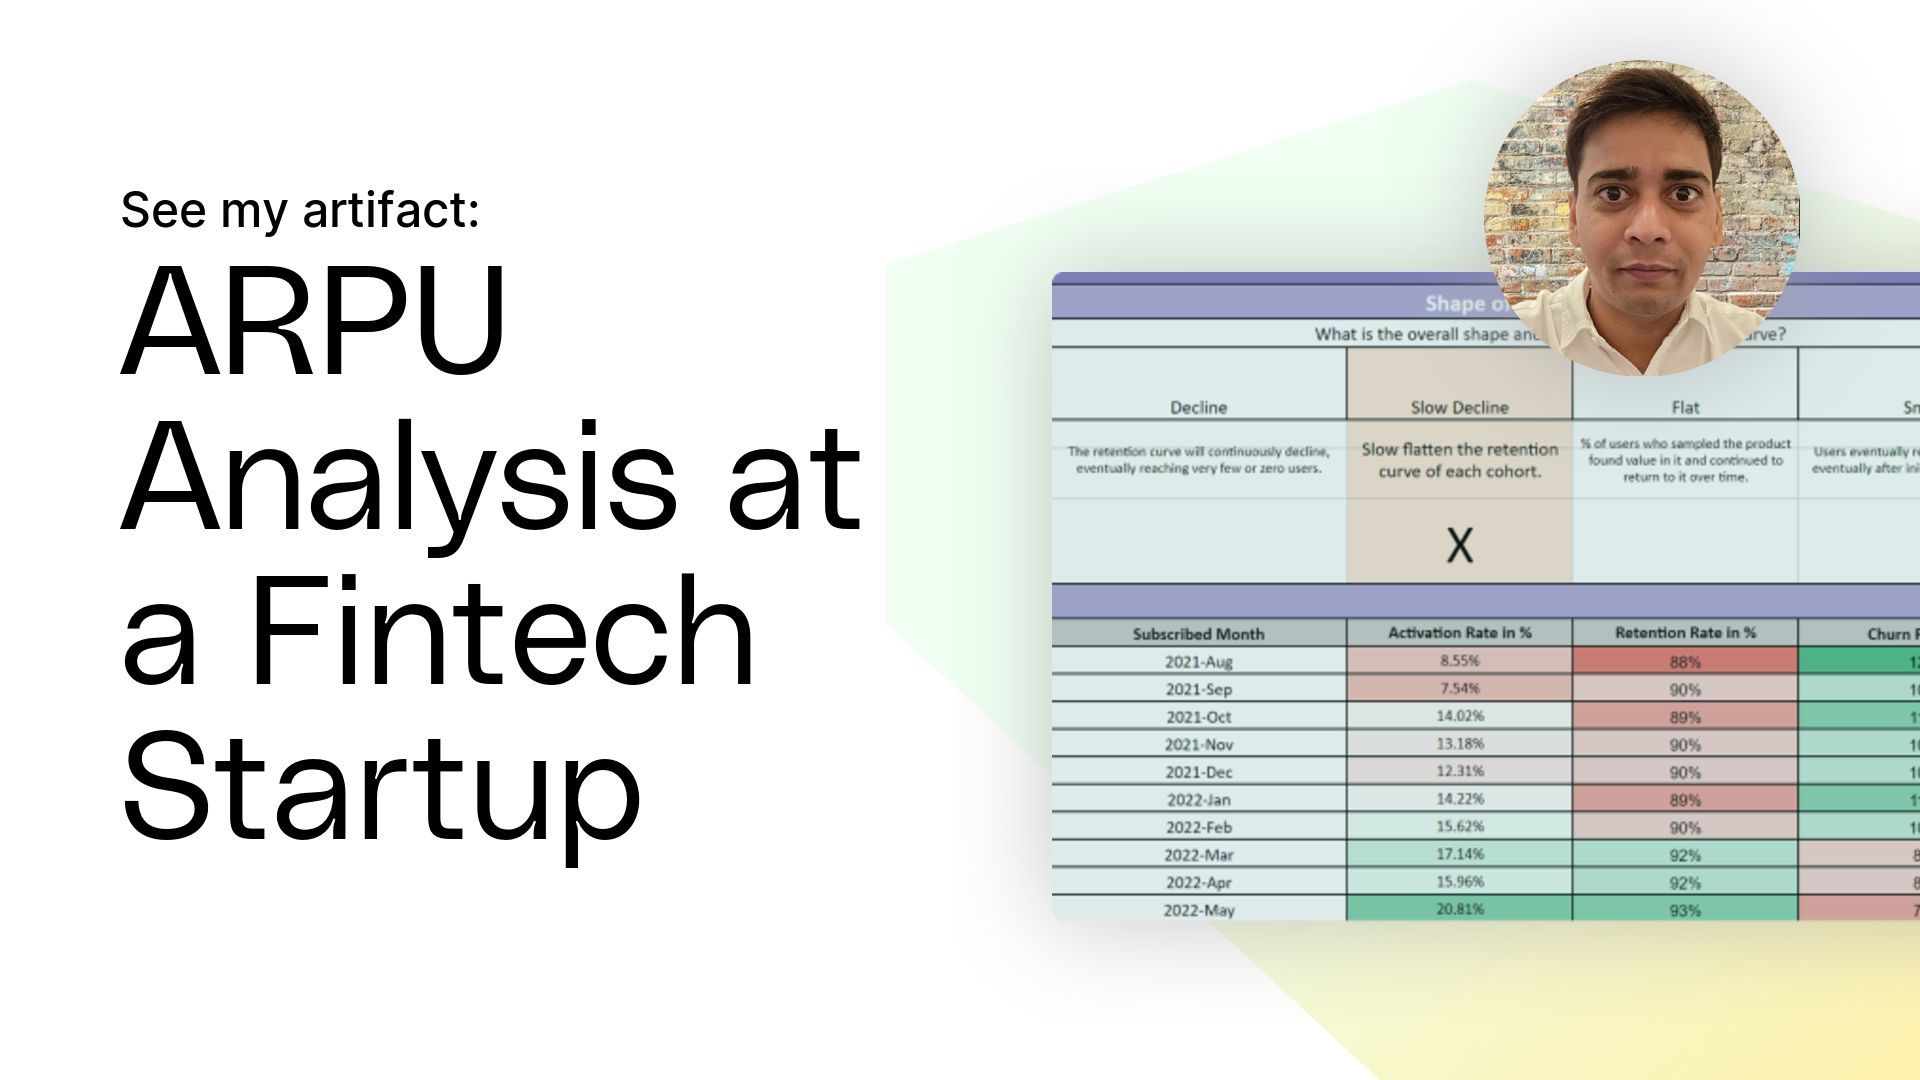
Abhinandan's ARPU analysis template provides fintech startups with a comprehensive overview of their Average Revenue Per User (ARPU) and overall business health. By visualizing key ROI metrics such as subscription month, activation rate, retention rate, and churn rate, this analysis offers insights into revenue trends and user behavior.
Abhinandan emphasizes the significance of user retention and transactional activities in achieving annual revenue targets. This template empowers fintech professionals to optimize revenue streams and enhance customer engagement strategies.
LTV Strategy at B2C Footwear Brand
Created by Mirela Cialai, Freelance Marketing Consultant
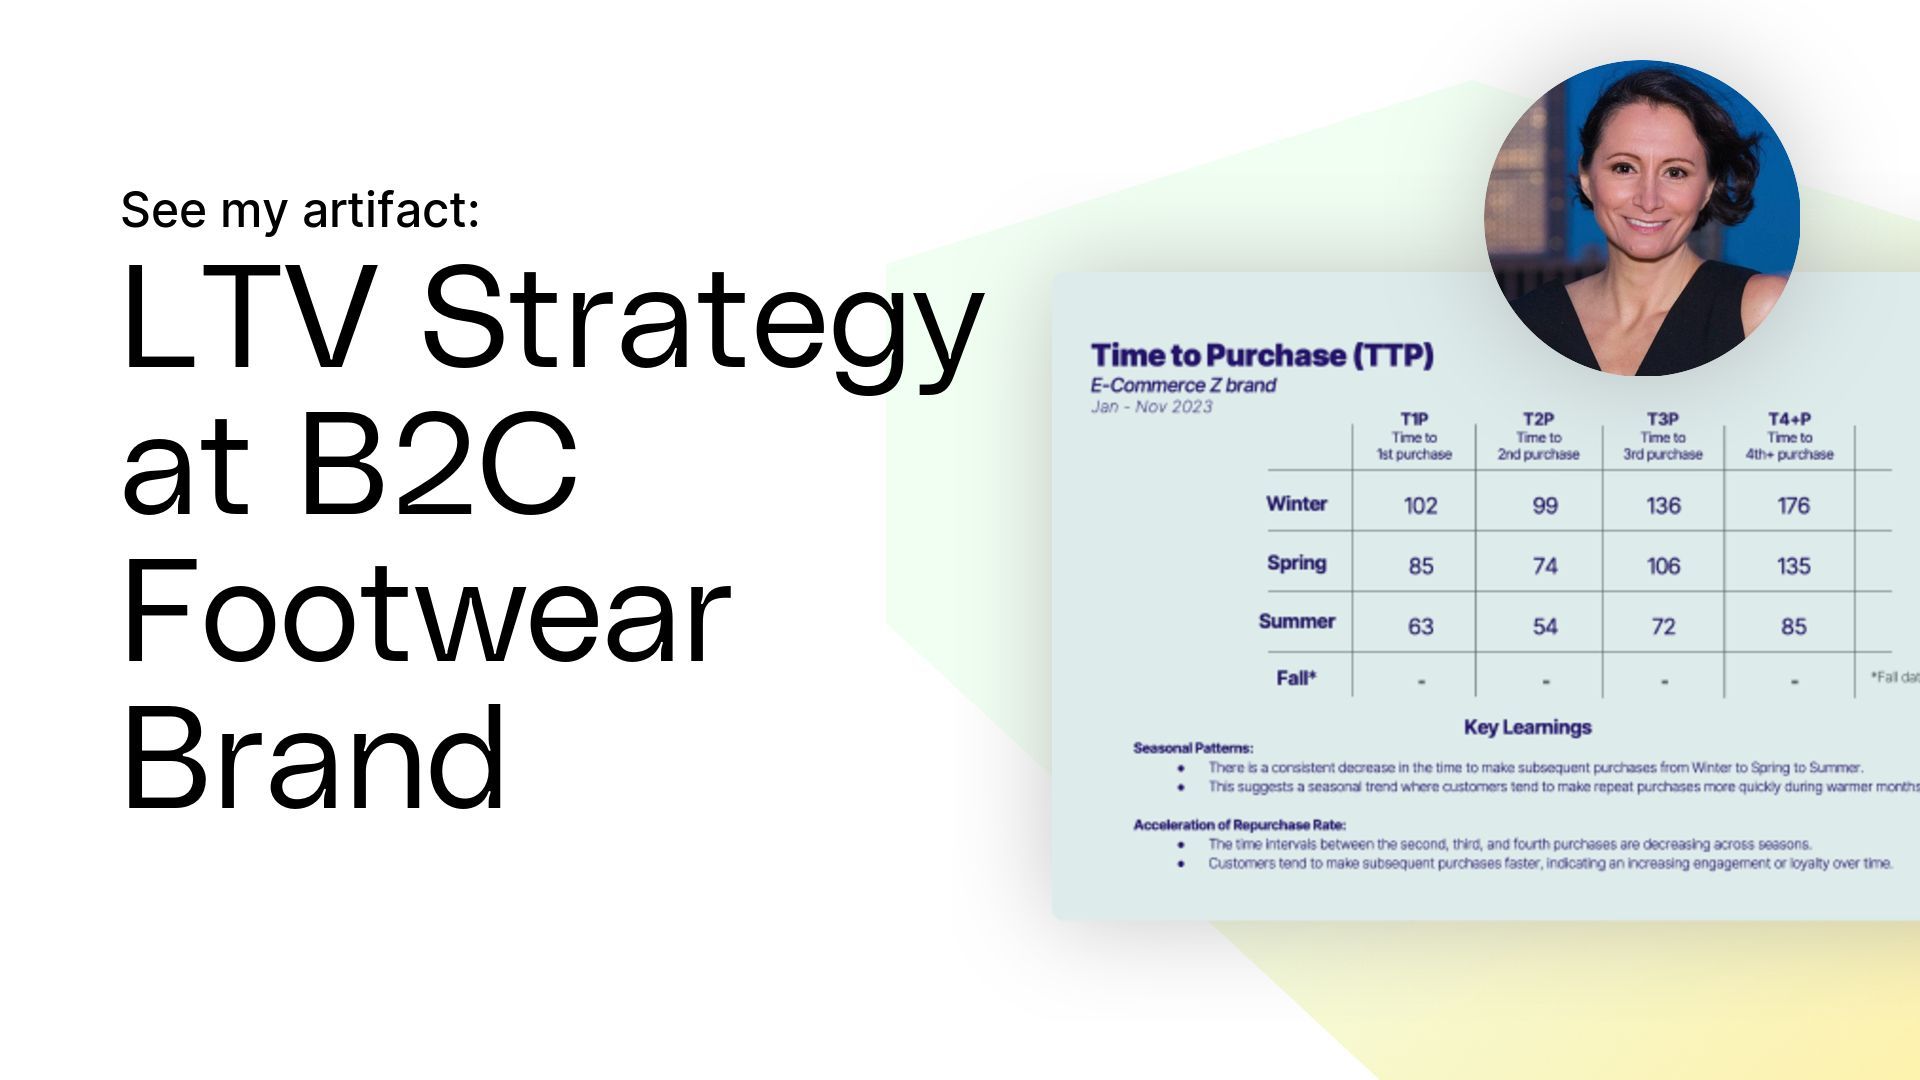
Mirela's LTV strategy deck, developed while consulting with a B2C footwear brand, emphasizes the importance of transitioning to an LTV-based approach for customer retention. This analysis advocates for segmenting customers based on purchase frequency and spending tiers to tailor marketing strategies effectively.
Mirela warns against confirmation bias in data interpretation and underscores the need for a holistic approach considering market trends and external factors. By leveraging LTV analysis, footwear brands can identify opportunities to drive repeat purchases and enhance customer loyalty.
Unit Economics and Profitability Enhancement at Vida Health
Crafted by Andry Haryanto, VP Finance & Strategy @ Vida Health

Andry's initiative at Vida Health explores revenue optimization strategies to enhance unit economics and profitability. During a recession planning phase, Andry's team successfully implemented tactics resulting in increased revenue and improved cash flow.
Despite facing challenges such as layoffs, the initiative proved to be a game-changer for Vida Health, highlighting the effectiveness of proactive revenue enhancement strategies. This template offers insights into optimizing unit economics and driving sustainable growth in the healthcare industry.
New Product ROI Methodology at Siply
Developed by Mukilan Pannirselvam, Head of Product @ Siply

Mukilan's document outlines a comprehensive methodology for estimating the return on investment (ROI) for new products, focusing on Total Addressable Market (TAM) analysis and pricing strategies. By considering internal and external factors, Mukilan provides a structured approach for startups to calculate expected ROI and define annual growth targets. This methodology includes a practical example of ROI calculation for a new product, offering startups actionable insights to drive profitability and market success.
How To Calculate Unit Economics & LTV for eCommerce Subscriptions at Ordergroove
Crafted by Eric Andrews, Director of Commerce Strategy & Growth @ Ordergroove
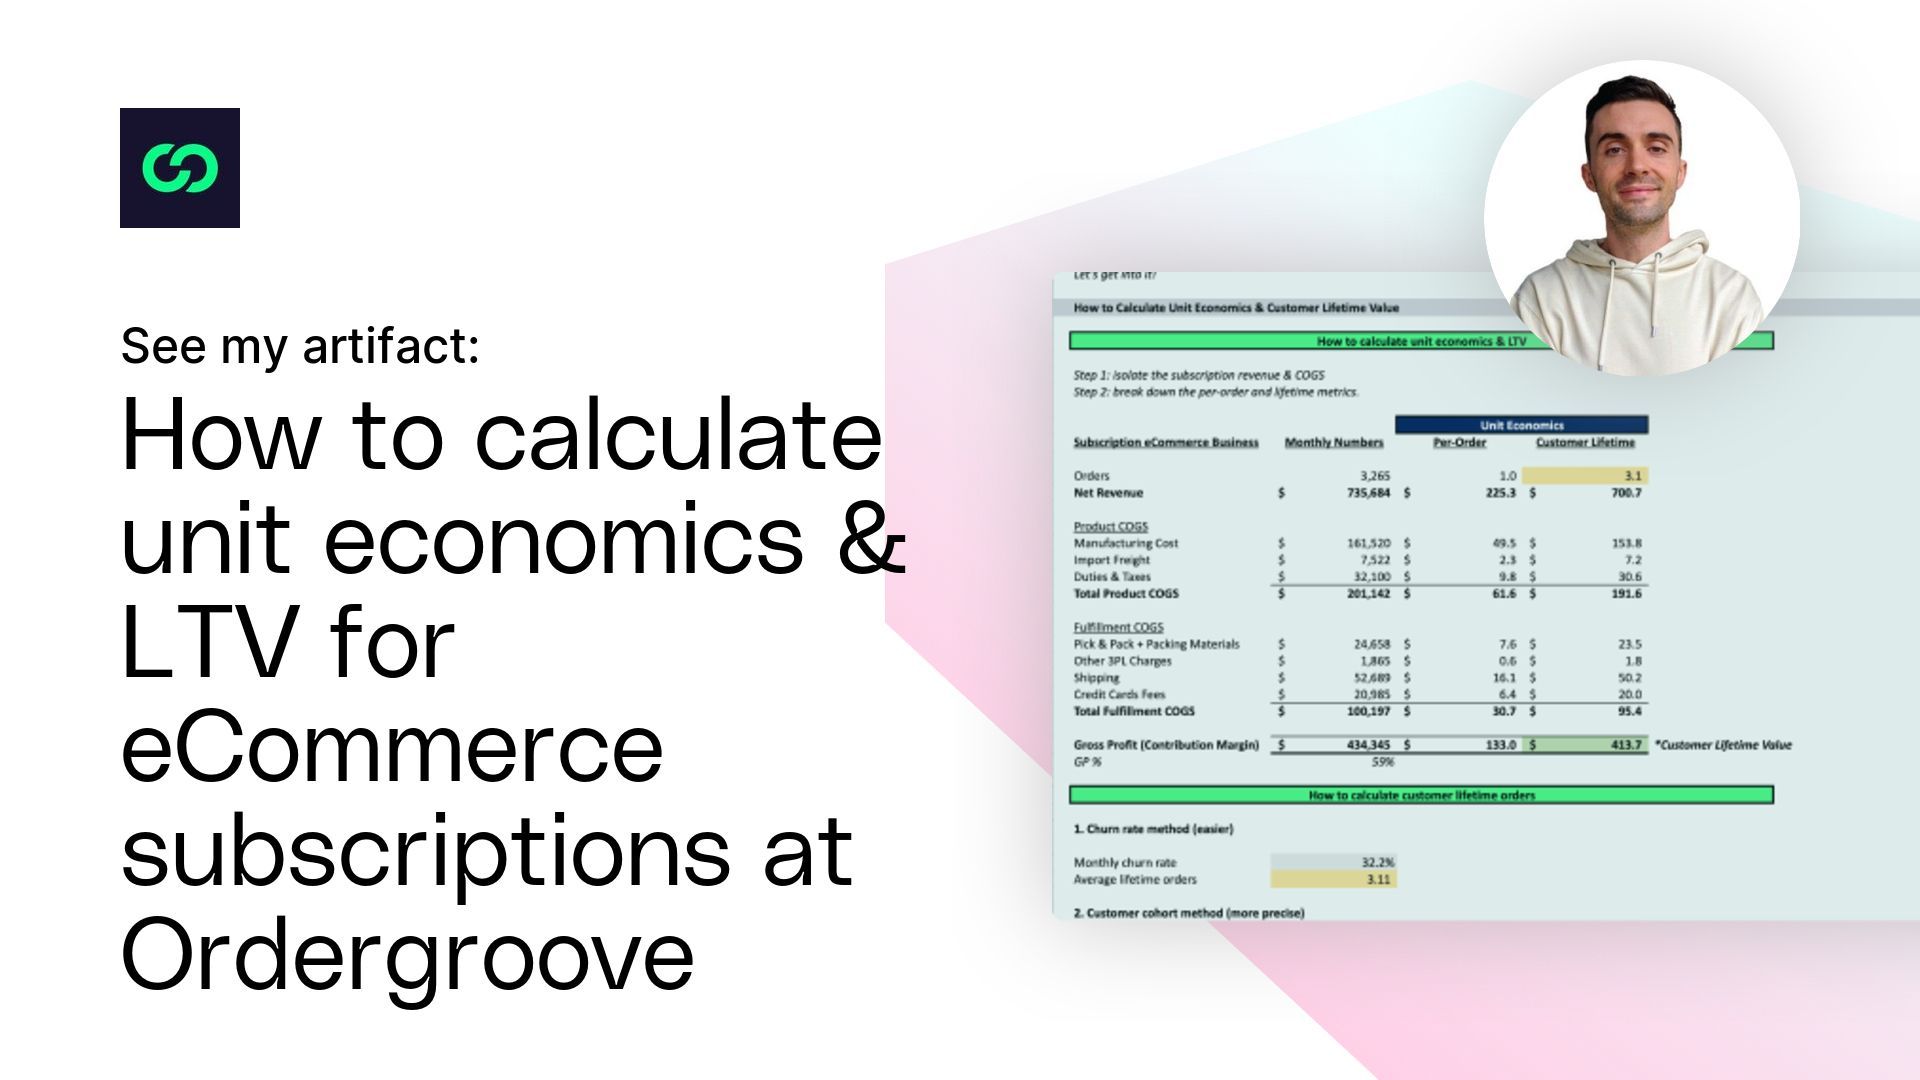
Eric's methodology for calculating unit economics and customer lifetime value (LTV) for subscription-based eCommerce businesses offers valuable insights for marketing and comparison purposes. By utilizing standard eCommerce financial and retention data, Eric's document provides eCommerce brands with a framework for optimizing unit economics and LTV.
This methodology aids in enhancing customer retention through strategies such as retention improvement, bundling, upselling, and loyalty programs, driving sustainable revenue growth for eCommerce brands.
How To Create Your Own ROI Report
Creating your own ROI report is essential for evaluating the effectiveness of your marketing campaigns. By generating a report tailored to your business's specific goals and focus areas, you can gain valuable insights into the performance of your marketing efforts.
Here's how you can create your own ROI report:
**Understand Your Goals: **Before diving into creating your ROI report, it's crucial to understand the goals of your marketing campaigns. Whether you're aiming to increase brand awareness, drive website traffic, generate leads, or boost sales, your ROI report should align with these objectives.
Choose the Right Template: Selecting the right template is key to creating an effective ROI report. Consider your business's needs and the metrics you want to track. HubSpot offers various templates for tracking different aspects of your marketing campaigns, such as reach, website visits, leads, acquisition, conversion rate, and more.
**Add Your Metrics: **Once you've chosen a template, populate it with relevant metrics. Include data on sales revenue, marketing costs, leads generated, conversion rates, customer time frame value, internal rate of return on ad spend, cost per lead, cost per acquisition, lead close rate, and any other relevant metrics for your business.
**Customize Your Report: **Tailor your report to fit your company's brand and style. Customize the graphs, charts, and visual elements to make them visually appealing and easy to understand. Add context to your data by providing explanations, insights, and recommendations based on the metrics.
**Tell a Compelling Story: **Use your ROI report to tell a compelling story about the success of your marketing efforts. Highlight key achievements, milestones, and areas for improvement. Provide actionable insights and recommendations for optimizing future campaigns.
**Share and Communicate: **Once your ROI report is complete, share it with stakeholders and decision-makers within your organization. Use the report as a tool for communication and collaboration, fostering discussions about the effectiveness of your marketing strategies and how to drive better results in the future.
The bottom line is that by adhering to this structured approach and utilizing the provided templates, you can streamline your ROI analysis processes and make informed decisions to optimize profitability. Whether you're a seasoned professional or a novice in financial management, these resources will equip you with the tools necessary to navigate the complex landscape of different investment evaluations.
The Top 7 ROI Analysis Templates To Track Your Profits
Return on Investment (ROI) is a fundamental financial metric used to assess the profitability of an investment relative to its cost of the investment. It measures the efficiency of an investment by comparing the gain or loss generated from the investment relative to its initial cost. Calculating ROI is crucial for businesses and individuals to evaluate the success of their investment decisions.
In this guide, we'll delve into the intricacies of ROI calculation, providing you with essential insights and free templates to streamline your analysis.
What Is Return on Investment (ROI)?
Return on Investment (ROI) is a crucial financial metric used to assess the profitability of an investment. It measures the incremental revenue generated relative to the investment cost. However, to accurately evaluate ROI, all associated total costs must be considered, including operational expenses, like materials, personnel, and other overheads.
Importance of Considering All Costs
Calculating ROI involves more than just looking at revenue. Operational costs, such as materials and labor, should be subtracted to determine the actual net profit generated. For instance, a $100K investment in manufacturing equipment may yield $500K in revenue, but after factoring in operational expenses, the actual profit may be less.
Example Illustration
Let's consider a scenario where a company invests $100,000 in a new CRM system, expecting to save $40,000 annualized ROI in staffing costs. While the revenue generated from the CRM system may be significant, it's essential to calculate ROI accurately by subtracting operational expenses.
ROI = [(Revenue - Operational Costs) / Investment Cost] x 100
In this example, the CRM system's ROI may initially appear negative (-68%) due to the high upfront costs. However, over a period of time, considering the long-term benefits and cost savings, the investment may become profitable.
Key Points To Remember
ROI calculation involves considering all costs associated with an investment.
Operational expenses should be subtracted from revenue to determine actual profit.
Accurately analyzing ROI helps in making informed investment decisions and evaluating the true financial impact of investments.
How To Calculate ROI in 5 Steps
Calculating marketing ROI in Excel can be simplified into a few straightforward steps:
**Set Up Your Spreadsheet: **Open Excel and create a new spreadsheet. Label one column for sales revenue and another for marketing costs. Enter the corresponding data for each.
Enter Your Data: Input the total sales revenue generated by your marketing campaign in the sales revenue column. Then, add the total amount spent on marketing activities in the marketing costs column.
Apply the ROI Formula: In a free cell, input the ROI formula: (Sales Revenue - Marketing Costs) / Marketing Costs. For example, if your sales revenue is in cell B2 and marketing costs are in cell B3, the formula would be =(B2 - B3) / B3.
Calculate ROI: Press enter or return on your keyboard to calculate the ROI. The result will be displayed as a decimal. To format it as a percentage, select the cell and go to the Home Tab > Number > Percentage.
Interpret and Communicate Results: Once you have calculated the ROI, interpret the result. A positive ROI indicates that your marketing campaign generated more revenue than it cost, while a negative ROI means the opposite. Provide context for the data when communicating it to stakeholders, highlighting the success and impact of the campaign.
By following these steps, you can effectively calculate and communicate the return on investment of your marketing efforts using Excel.
7 ROI Templates By Experts To Use in 2024
SEO Content ROI Model at Graphite
Developed by Ethan Smith, CEO @ Graphite
This ROI model, crafted by Graphite, offers a versatile framework for predicting traffic and assessing the net return on investment for SEO articles. Ethan's model utilizes observed traffic data over several months to extrapolate future traffic trends.
Notably, it projects a traffic plateau by the third year and demonstrates a payback period of six months, indicating a transition from negative to positive profit. This model equips businesses with valuable insights into the long-term profitability of their SEO content initiatives.
ARPU Analysis at a Fintech Startup
Crafted by Abhinandan Yadav, Product Manager, Growth @ Beem
Abhinandan's ARPU analysis template provides fintech startups with a comprehensive overview of their Average Revenue Per User (ARPU) and overall business health. By visualizing key ROI metrics such as subscription month, activation rate, retention rate, and churn rate, this analysis offers insights into revenue trends and user behavior.
Abhinandan emphasizes the significance of user retention and transactional activities in achieving annual revenue targets. This template empowers fintech professionals to optimize revenue streams and enhance customer engagement strategies.
LTV Strategy at B2C Footwear Brand
Created by Mirela Cialai, Freelance Marketing Consultant
Mirela's LTV strategy deck, developed while consulting with a B2C footwear brand, emphasizes the importance of transitioning to an LTV-based approach for customer retention. This analysis advocates for segmenting customers based on purchase frequency and spending tiers to tailor marketing strategies effectively.
Mirela warns against confirmation bias in data interpretation and underscores the need for a holistic approach considering market trends and external factors. By leveraging LTV analysis, footwear brands can identify opportunities to drive repeat purchases and enhance customer loyalty.
Unit Economics and Profitability Enhancement at Vida Health
Crafted by Andry Haryanto, VP Finance & Strategy @ Vida Health
Andry's initiative at Vida Health explores revenue optimization strategies to enhance unit economics and profitability. During a recession planning phase, Andry's team successfully implemented tactics resulting in increased revenue and improved cash flow.
Despite facing challenges such as layoffs, the initiative proved to be a game-changer for Vida Health, highlighting the effectiveness of proactive revenue enhancement strategies. This template offers insights into optimizing unit economics and driving sustainable growth in the healthcare industry.
New Product ROI Methodology at Siply
Developed by Mukilan Pannirselvam, Head of Product @ Siply
Mukilan's document outlines a comprehensive methodology for estimating the return on investment (ROI) for new products, focusing on Total Addressable Market (TAM) analysis and pricing strategies. By considering internal and external factors, Mukilan provides a structured approach for startups to calculate expected ROI and define annual growth targets. This methodology includes a practical example of ROI calculation for a new product, offering startups actionable insights to drive profitability and market success.
How To Calculate Unit Economics & LTV for eCommerce Subscriptions at Ordergroove
Crafted by Eric Andrews, Director of Commerce Strategy & Growth @ Ordergroove
Eric's methodology for calculating unit economics and customer lifetime value (LTV) for subscription-based eCommerce businesses offers valuable insights for marketing and comparison purposes. By utilizing standard eCommerce financial and retention data, Eric's document provides eCommerce brands with a framework for optimizing unit economics and LTV.
This methodology aids in enhancing customer retention through strategies such as retention improvement, bundling, upselling, and loyalty programs, driving sustainable revenue growth for eCommerce brands.
How To Create Your Own ROI Report
Creating your own ROI report is essential for evaluating the effectiveness of your marketing campaigns. By generating a report tailored to your business's specific goals and focus areas, you can gain valuable insights into the performance of your marketing efforts.
Here's how you can create your own ROI report:
**Understand Your Goals: **Before diving into creating your ROI report, it's crucial to understand the goals of your marketing campaigns. Whether you're aiming to increase brand awareness, drive website traffic, generate leads, or boost sales, your ROI report should align with these objectives.
Choose the Right Template: Selecting the right template is key to creating an effective ROI report. Consider your business's needs and the metrics you want to track. HubSpot offers various templates for tracking different aspects of your marketing campaigns, such as reach, website visits, leads, acquisition, conversion rate, and more.
**Add Your Metrics: **Once you've chosen a template, populate it with relevant metrics. Include data on sales revenue, marketing costs, leads generated, conversion rates, customer time frame value, internal rate of return on ad spend, cost per lead, cost per acquisition, lead close rate, and any other relevant metrics for your business.
**Customize Your Report: **Tailor your report to fit your company's brand and style. Customize the graphs, charts, and visual elements to make them visually appealing and easy to understand. Add context to your data by providing explanations, insights, and recommendations based on the metrics.
**Tell a Compelling Story: **Use your ROI report to tell a compelling story about the success of your marketing efforts. Highlight key achievements, milestones, and areas for improvement. Provide actionable insights and recommendations for optimizing future campaigns.
**Share and Communicate: **Once your ROI report is complete, share it with stakeholders and decision-makers within your organization. Use the report as a tool for communication and collaboration, fostering discussions about the effectiveness of your marketing strategies and how to drive better results in the future.
The bottom line is that by adhering to this structured approach and utilizing the provided templates, you can streamline your ROI analysis processes and make informed decisions to optimize profitability. Whether you're a seasoned professional or a novice in financial management, these resources will equip you with the tools necessary to navigate the complex landscape of different investment evaluations.